

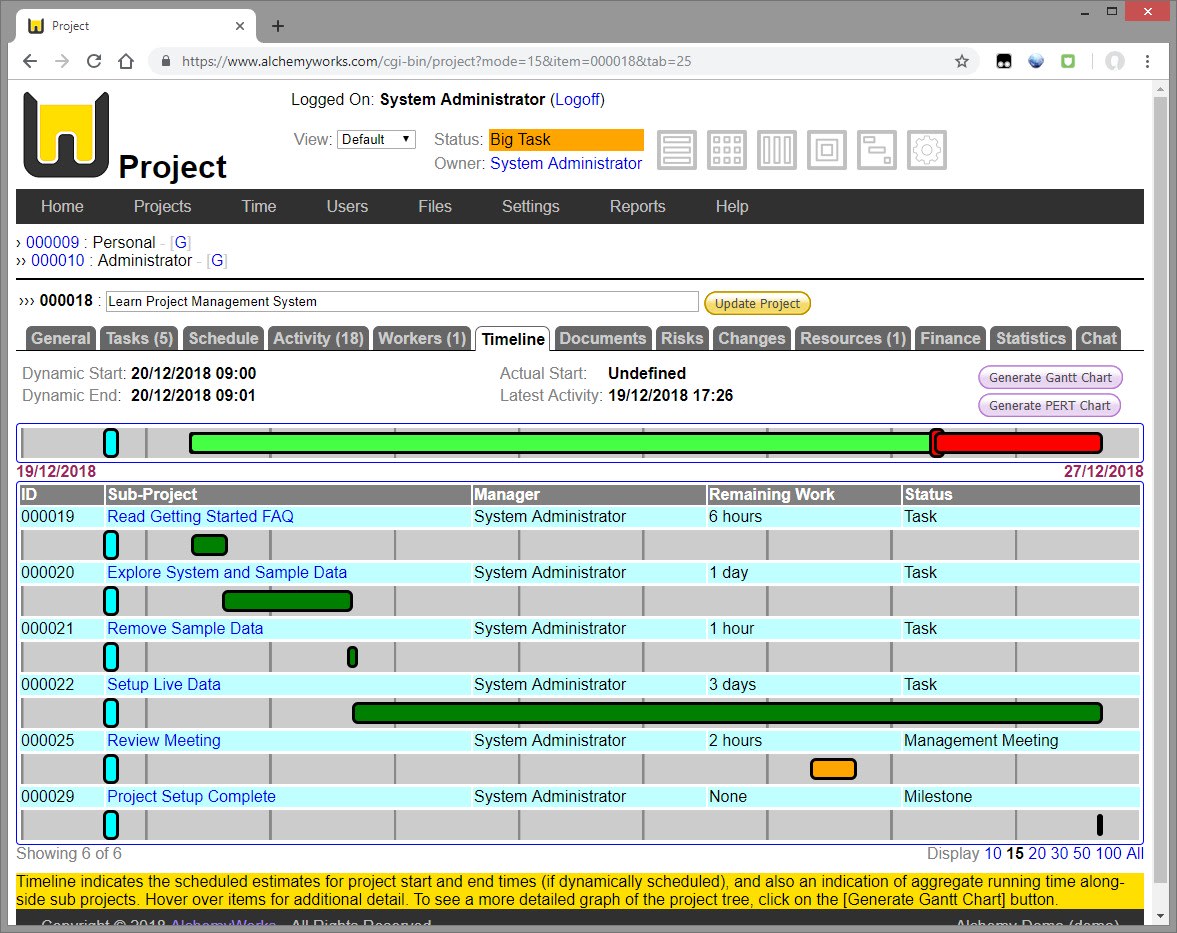
Project timeline view indicates the scheduled estimates for project start and end times (if dynamically scheduled), and also an indication of running time along-side sub projects. The sub-project bars show a rolled up timeline for the whole project hierarchy below them. A more detailed view can be shown by clicking on the Generate Gantt Chart button, which includes options to see the whole project tree, or sub-sections based on a number of criteria such as project manager or time ranges.
Other views are also available such as AON or PERT charts, which show project and task dependencies in a graphical form with critical path calculatons. For individual project managers and work load information check out the calendar views such as agenda, day, week or month layouts. Current activity can be reviewed via the user utilization report.
All graphs show additional detail by hovering over items, and click through to appropriate maintenance screens. Also shown are deadline and due dates, which are inherited by subsidiary tasks and projects.