

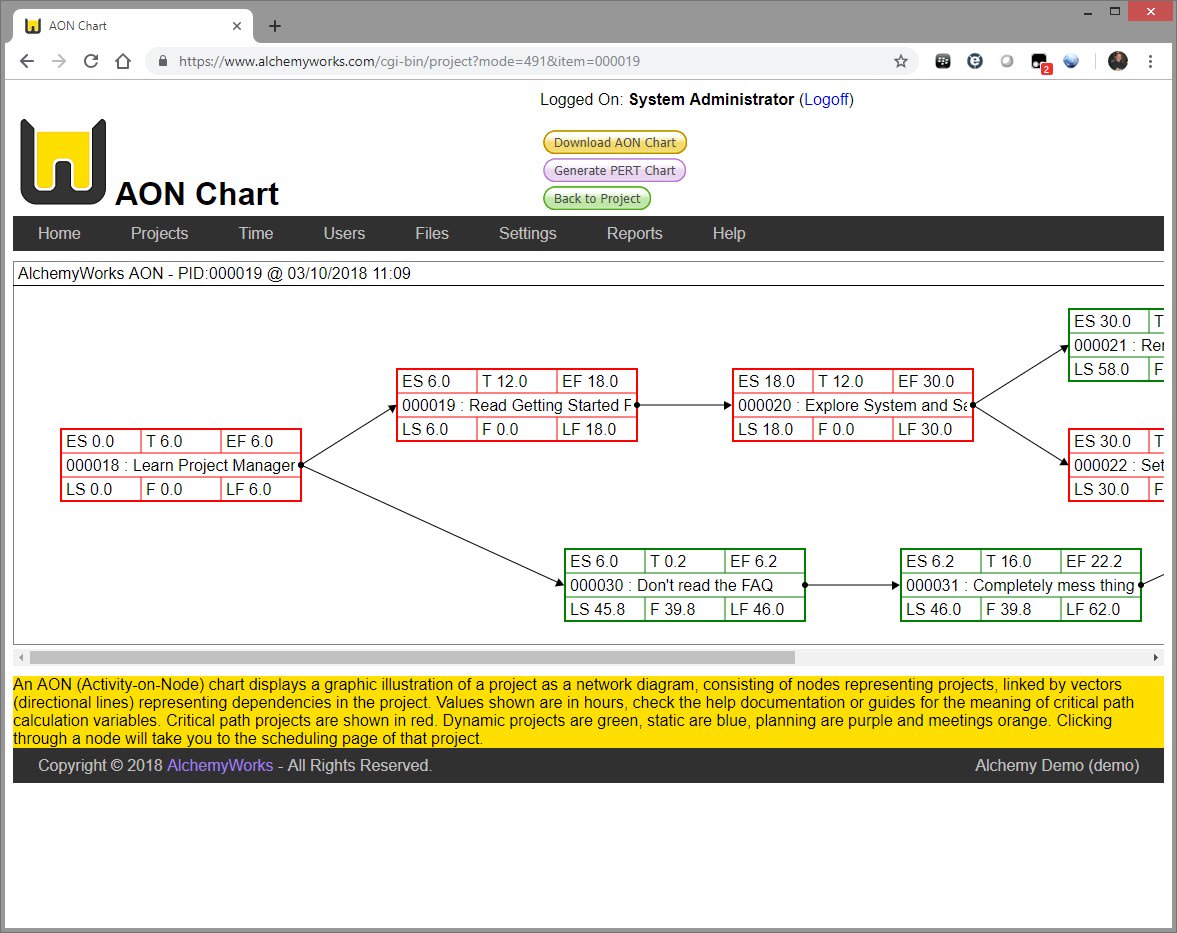
An AON (Activity-on-Node) chart displays a graphic illustration of a project as a network diagram, consisting of nodes representing projects or tasks, linked by vectors (directional lines) representing dependencies in the project. Values shown are in hours, check the help documentation or project guides for the meaning of critical path calculation variables.
AON charts can be generated from any task or project in the hierarchy, and will include any dependent elements. Note that Gantt and PERT charts can also be generated, and that all charts can be downloaded as SVG images for inclusion in reports and presentations.
Critical path projects on the chart are shown in red. Dynamically scheduled projects are shown in green, static are blue, planning projects are purple and meetings orange. Hover over nodes for additional detail. Clicking through a node will take you to the scheduling page of that project.