

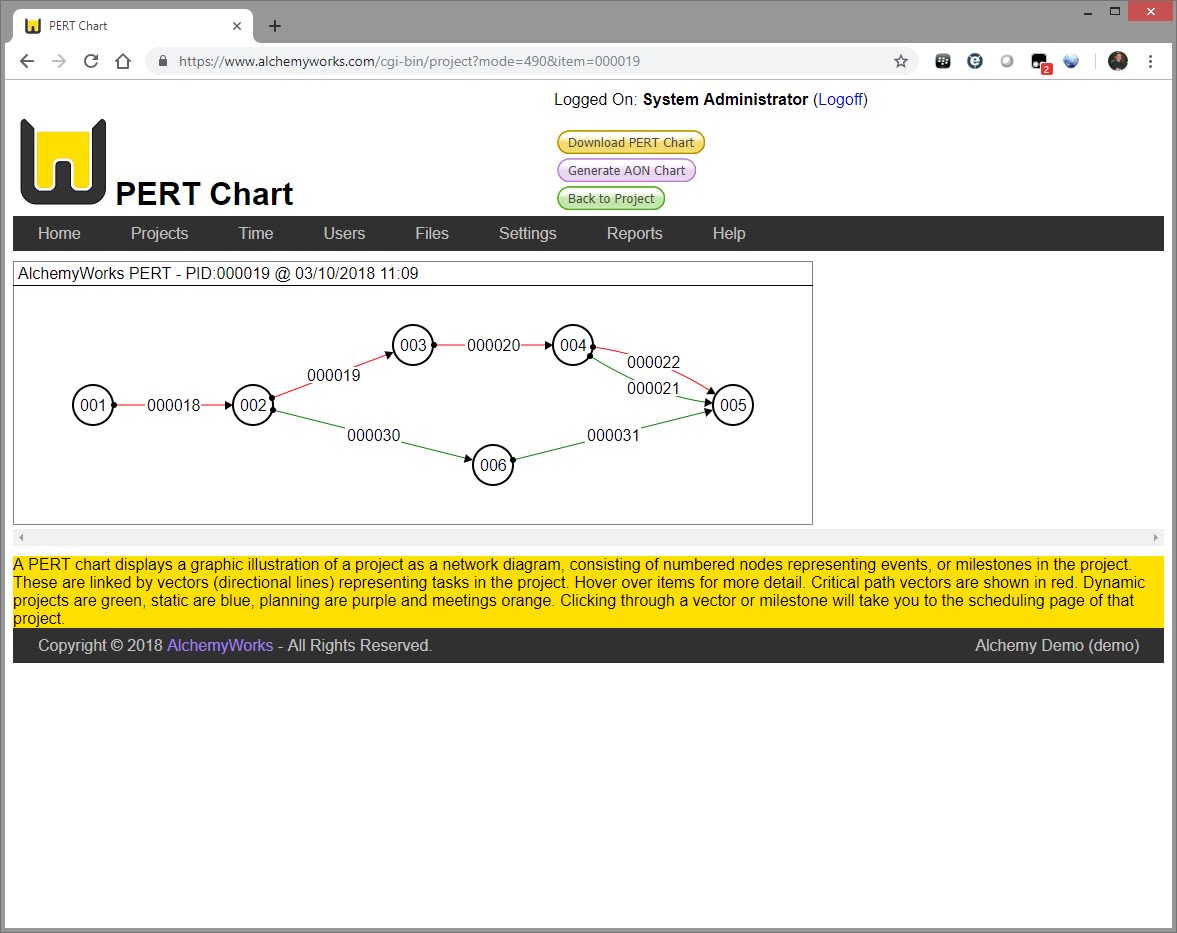
A PERT chart displays a graphic illustration of a project as a network diagram, consisting of numbered nodes representing events, or milestones in the project. These are linked by vectors (directional lines) representing tasks in the project.
PERT charts can be generated from any task or project in the hierarchy, and will include any dependent elements. Where milestones already exist they will be used, or additional ones created in order to construct the graph.
Critical path vectors are shown in red. Dynamically scheduled projects are depicted in green, statically scheduled are in blue, planning are purple and meetings orange. Hover over milestone or vector items for additional detail.
Clicking through a vector or milestone will take you to the scheduling page of that project.
Note that Gantt and AON charts can also be generated, and that all charts can be downloaded as SVG images for inclusion in reports and presentations.
For more information on critical paths in projects and how they are worked out, see the Critical Path Calculations guide.