

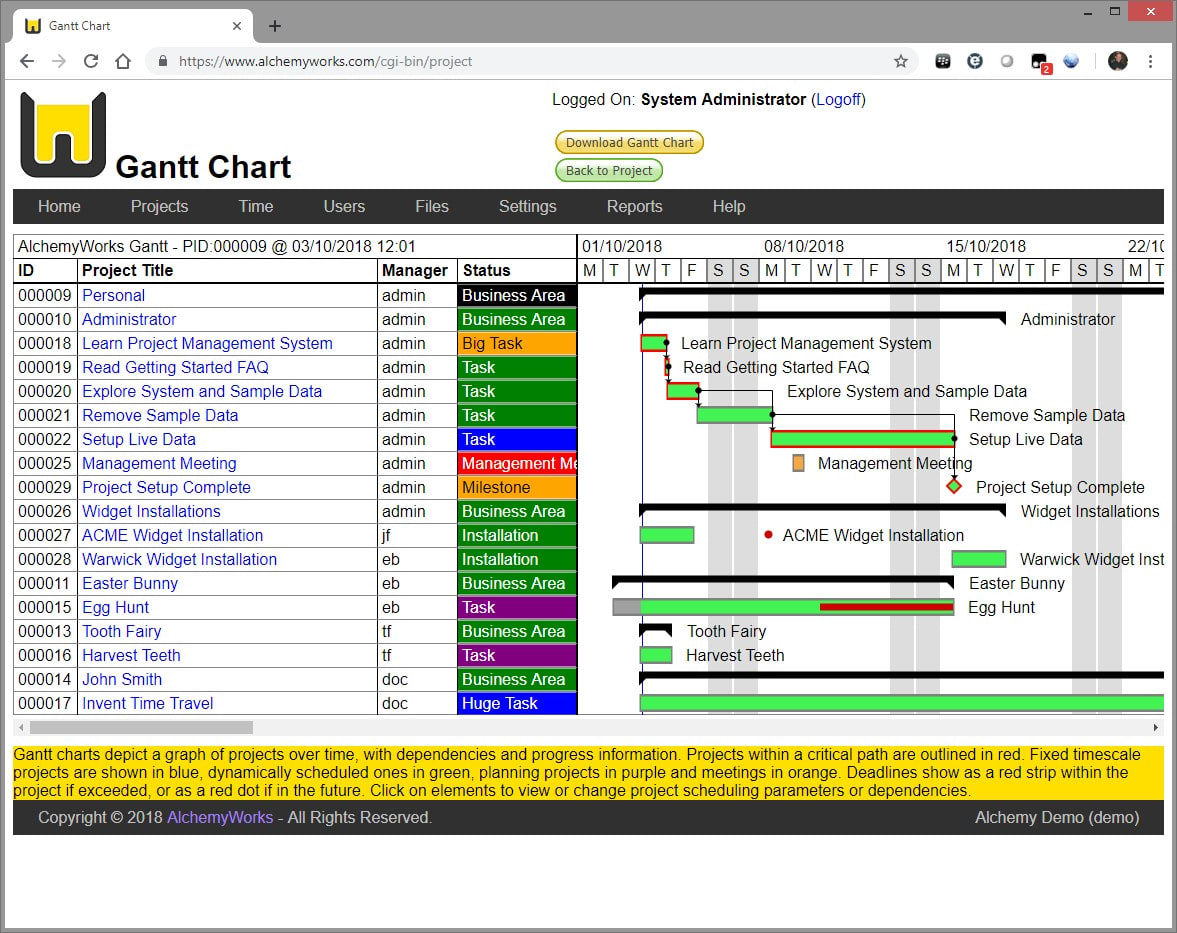
Gantt charts depict a graph of projects over time, with dependencies and progress information.
This is generated from the timeline view of a project, and can be produced at any position in the project tree hierarchy. The Gantt generation dialog allows setting a wide range of criteria through which tasks are selected fot the chart, including manager, time ranges, dependencies and status conditions. PERT charts and AON charts can also be produced from the timeline view.
Projects on the Gantt chart which are within a critical path are outlined in red. Fixed timescale projects are shown in blue, dynamically scheduled ones in green, planning projects in purple and meetings in orange. Deadlines show as a red strip within the project if exceeded, or as a red dot if in the future.
Percentage completion and exact scheduling times are shown on the right hand side of the table, with additional information available when hovering over items. Clicking through elements takes you to the appropriate scheduling page of the related project, where dependencies or time constraints can be changed.